The debugger window
Bizmuth has a built-in graphical debugger — a GUI front-end over the same machine the ADP protocol drives. Open it from Debug → Open Debugger (or F1); the same key toggles it closed.
Panels
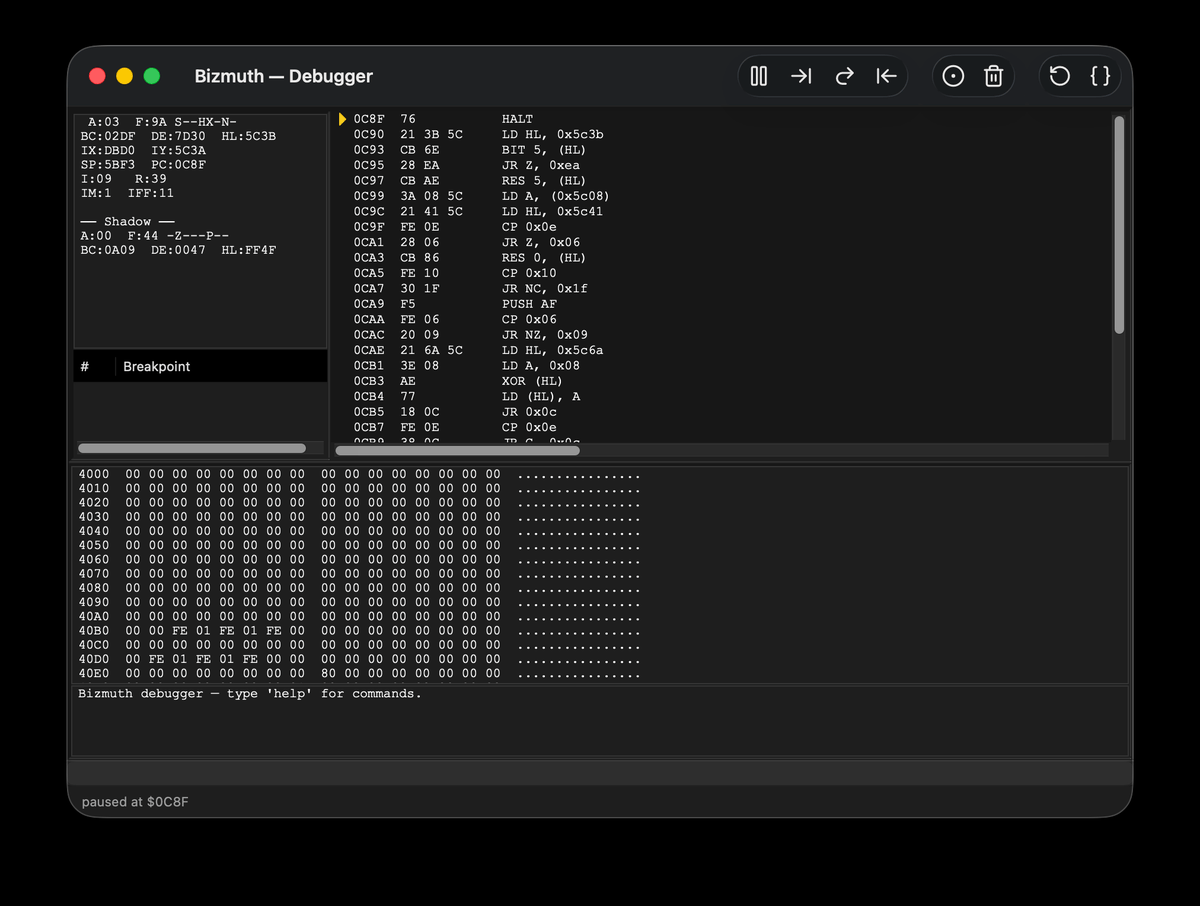
The window splits into five panels:
- Registers — the CPU register set, updated whenever the machine is paused (it reads “(pause emulation to see registers)” while running).
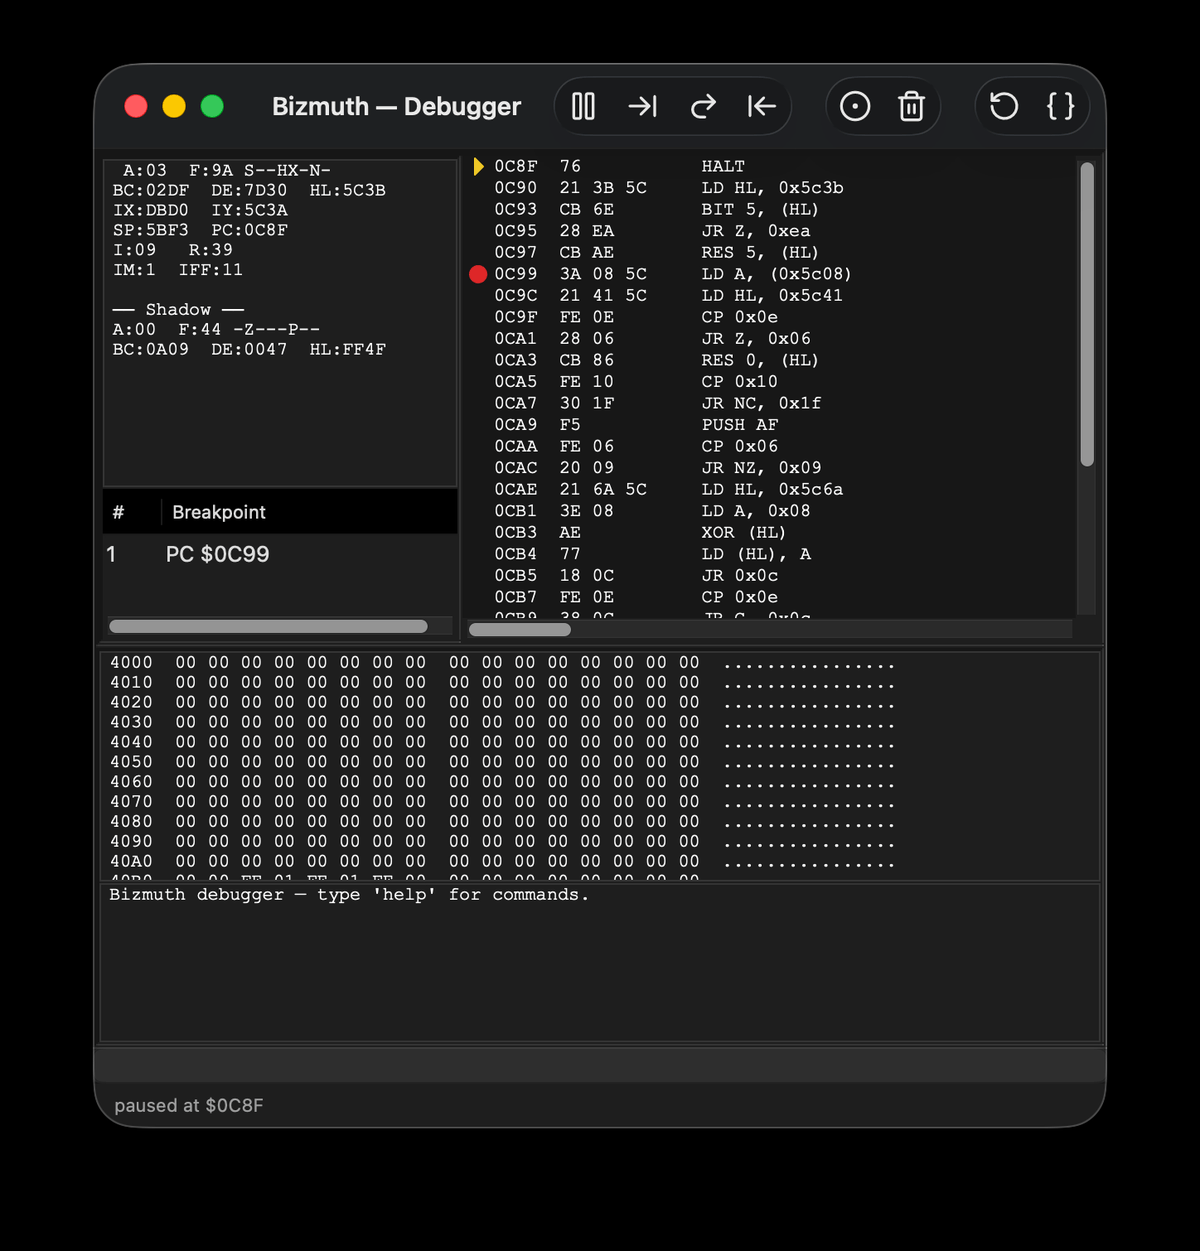
- Disassembly — a live disassembly around the program counter in a Scintilla view, with a symbol gutter on the left: a red dot marks a breakpoint and an arrow marks the current PC. Click the gutter to toggle a breakpoint on that line.
- Memory — a scrollable hex view of memory (paging-resolved, like ADP
mem). - Breakpoints — the current breakpoints in a list; right-click for a context menu (Remove breakpoint / Remove all breakpoints).
- Output console — append-only command replies and log messages (“type ‘help’ for commands”).
The command bar
Below the panels is a command bar — type any ADP command (press Enter) and the reply appears in the output console. help lists them. This is the full ADP surface in the GUI: mem, disasm, bp add …, nr, screenshot, savestate, and the rest all work here exactly as they do over TCP, so anything the ADP reference documents you can run from the window without a socket client.
Execution control
The toolbar and the Debug menu share the same accelerators:
| Action | Shortcut | |
|---|---|---|
| Pause / Resume | F5 | stop at / resume from the current instruction |
| Step (into) | F8 | execute one instruction |
| Step Over | F10 | step over a CALL / block instruction |
| Step Back | (toolbar) | reverse one instruction from the snapshot history |
| Toggle / Clear Breakpoint | (toolbar) | set a breakpoint at the PC / remove all |
| Load Symbols… | (Debug menu) | load a sjasmplus .map so addresses show as labels |
Step Back replays saved machine snapshots (taken before each step/pause), so it’s exact but only reaches as far back as the recorded history — see ADP → step-back.
For a scriptable, editor-independent interface to the same machine — and for headless use — see The ADP debugger and Rhai scripting.